-
[유저 이탈 지표 구축 프로젝트]K-means Clustering 예제코딩 및 데이터분석/데이터 분석(pandas, numpy 등) 2024. 1. 26. 04:18
https://lucy-the-marketer.kr/ko/growth/k-means-clustering-python-customer-data-analysis/
K-Means 클러스터링 파이썬 연습 예제 – 고객 구매 데이터 분석
K-Means 클러스터링의 파이썬 예제이다. 본 예제에서는 고객 구매 데이터를 분석하여 유의미한 인사이트를 얻어보는 과정을 다룬다. K-Means에 대한 개념적인 설명은 다음 글(클릭)을 참고하면 좋다
lucy-the-marketer.kr
K-Means Clustering Exercise
In [6]:# import pandas package import pandas as pd # load excel file using read_excel() function df = pd.read_excel('CustomerDataSet.xlsx') # see the first few lines using head() function df.head() # df.tail()Out[6]:Customer IDItemsBoughtItemsReturnedZipCodeProduct8910111214 9 9 8 2435 15 36 7 2 1764 16 42 1 1 1547 17 46 1 1 1265 21 41 22 9 2465 In [7]:# import KMeans, matplotlib.byplot, preprocessing package from sklearn.cluster import KMeans import matplotlib.pyplot as plt from sklearn import preprocessing # copy the dataframe before preprocessing using copy() function (don't do it on the original dataframe) processed_data = df.copy() # create the normaliser 'scaler' using preprocessing.MinMaxScaler() function scaler = preprocessing.MinMaxScaler() # preprocess following features: 'ItemsBought' and 'ItemsReturned' using fit_transform() function processed_data[['ItemsBought', 'ItemsReturned']] = scaler.fit_transform(processed_data[['ItemsBought', 'ItemsReturned']]) # setup a figure. You can maniplate the numbers to adjust size plt.figure(figsize=(10,10)) # iterate them to test K values for i in range(1,7): # create cluster estimator = KMeans(n_clusters = i) ids = estimator.fit_predict(processed_data[['ItemsBought', 'ItemsReturned']]) # add a subplot with 2 rows and 3 columns (index = i) plt.subplot(3,2,i) plt.tight_layout() # labeling the subplot plt.title("K value = {}".format(i)) plt.xlabel('ItemsBought') plt.ylabel('ItemsReturned') # plot the scatters plt.scatter(processed_data['ItemsBought'], processed_data['ItemsReturned'], c=ids) # show the figure plt.show() Examine the relationship between each cluster and product IDIn [10]:
# create the clusterer for K = 4
estimator = KMeans(n_clusters = 4)


# create the clustering
cluster_ids = estimator.fit_predict(processed_data[['ItemsBought', 'ItemsReturned']])

# plot the scatters
plt.scatter(processed_data['ItemsBought'], processed_data['ItemsReturned'], c=cluster_ids)


# labeling each data point with its product id
for index, c_id, bought, returned, zip_code, product in processed_data.itertuples():
    plt.annotate("Clu{}: {}".format(cluster_ids[index], product),(bought, returned))

# setup the labels of the plot
plt.xlabel('ItemsBought')
plt.ylabel('ItemsReturned')
plt.show()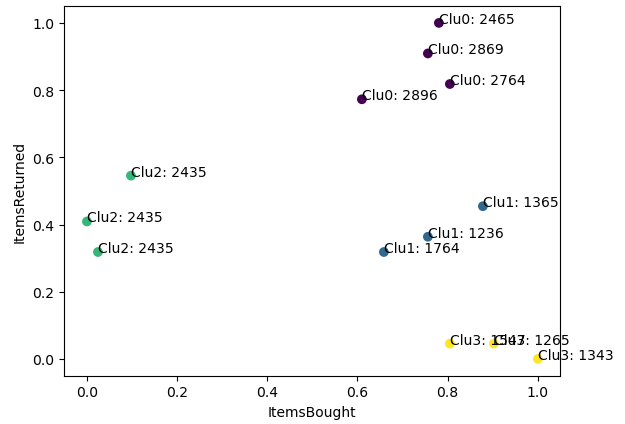
클러스터 0번 (보라) : 많이 사지만 많이 환불
클러스터 1번 (파랑) : 많이 사고 적당히 환불
클러스터 2번 (초록) : 적게 사고 꽤 환불
클러스터 3번 (노랑) : 많이 사고 적게 환불
인사이트:
사지도 않는데 환불은 많은 2번 클러스터의 제품이 뭔지 파악하여 개선해야함
많이 사긴 하는데 환불도 많이하는 0번 클러스터 또한 원인을 파악해야 함
# 데이터에 Cluster ID 태깅 컬럼 삽입
df['ClusterID'] = cluster_ids
내 생각: 예제는 육안으로도 보기 좋게 K=3 or K=4일 때 잘 나뉘지만, 실제 대규모 데이터에서는 K값을 무엇으로 잡냐가 고민될 듯.
따라서 다음에는 최적의 K-값 찾는 방법론을 학습해야 함
'코딩 및 데이터분석 > 데이터 분석(pandas, numpy 등)' 카테고리의 다른 글
[유저 이탈 지표 구축 프로젝트][스크랩] (0) 2024.01.24 [네트워크 분석] Pyvis 패키지를 이용한 유저 간 거래 네트워크 분석 (1) (2) 2023.12.20 [스크랩] 250+ Python and Data Science Tips — Covering Pandas, NumPy, ML Basics, Skl (0) 2023.09.20 파이썬으로 데이터 주무르기 - 챕터 1 실습 (0) 2023.07.23